0
-
An empty cart
You have no item in your shopping cart
envato-wordpress-toolkit domain was triggered too early. This is usually an indicator for some code in the plugin or theme running too early. Translations should be loaded at the init action or later. Please see Debugging in WordPress for more information. (This message was added in version 6.7.0.) in /var/www/wp-includes/functions.php on line 6121g5plus-darna domain was triggered too early. This is usually an indicator for some code in the plugin or theme running too early. Translations should be loaded at the init action or later. Please see Debugging in WordPress for more information. (This message was added in version 6.7.0.) in /var/www/wp-includes/functions.php on line 6121A range of methods exists for testing various aspects of a filter ’ s performance. These will be briefly discussed here, although a more complete review of test methods and standards is given in Handbook of Filter Media (Derek B. Purchas and Ken
Sutherland, 2002, 2nd Edition, Elsevier Advanced Technology, Oxford).
The classic method of determining the absolute rating of a filter and its efficiency is by the bead challenge test, originally using spherical glass beads (ballotini), although a wide range of test materials is now available. In the test, beads of varying, but known, diameters are introduced in known concentrations and amounts to the feed flow to the filter under test. The filtrate is examined for the beads that have passed through the filter, and it is analysed in the appropriate way.
The simplest test is to look in the filtrate for the largest bead that can be found, whose diameter stipulates the absolute cut-off rating for the filter. A more thorough test involves a complete count of the particles in the filtrate by particle size, and
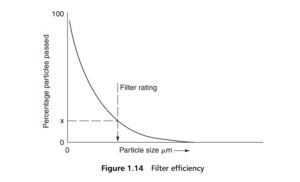
the plotting of the results as percentage of the fed particles of a certain size passing through the filter against that size, in micrometres, as illustrated in Figure 1.14 . This plot can then be used to establish the characteristics of the filter, showing, for
example, the nominal rating in μm as the particle size at which x% of the fed beads of this size pass through the filter, i.e. at this size, the filter efficiency is x%. Ratings are usually expressed at percentages passing between 10 and 2.
The efficiency of a filter describes its ability to guarantee the quality of the filtrate, and should be measured under conditions that most closely represent the real operating situation.
The true efficiency equation needs to take note of the presence of contaminants in the test fluid. On a count basis, this should be determined as:

where: A = particle count added to the fluid upstream of the filter housing, B=particle count downstream of the filter element, and C = particle count downstream of the filter housing, but in the absence of a filter element.
The inclusion of the blank count, C, ensures that the actual number of particles incident upon the filter is properly measured. Such inclusion is particularly important where contaminant loadings are measured by weighing rather than counting.
The bead challenge test is time-consuming, and has considerable practical limitations where micrometre-sized beads are involved. Whilst the feed dosage can be counted by weighing, the segregation and counting of the particles in the filtrate is
a very exacting task, as well as being subject to limitations such as the provision of accurate depth of focus and field of view in the microscope.
In addition to glass beads, various other forms of test particles are used in the counting test. Glass beads are mainly used in the size range 10 to 25 um, while finer particles are available as sand (down to 0.25 um) and iron oxide (down to 0.5 um). A very wide range of test dusts is available for air filter testing (in the range 1 to 100 um), while di-octyl phthalate (DOP) is also used for the evaluation of air filters, with a particle size of about 0.3 μm.
A specific test method exists to measure the size of the largest hard, spherical particle passed by a filter, and hence determine its absolute rating. The test rig is illustrated schematically in Figure 1.15, much of which is included to provide a clean basis for the test. Thus the fluid is first circulated through a clean-up filter until a sample shows
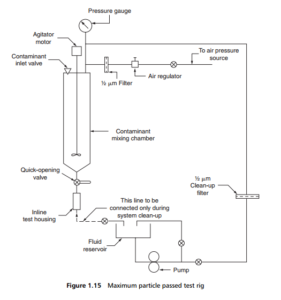
a cleanliness level of 0.4 mg/100 ml, by gravimetric analysis. A measured quantity of artificial contaminant in graded sizes (usually glass beads in the size range 2–80 um) is then introduced into the mixing chamber. After sufficient agitation, a measured volume of the resultant suspension is passed through the test filter housing and collected in a beaker. This filtrate is then passed through a very fine membrane filter, to remove and collect all of the suspended particles from that filtrate sample. The solids on the membrane surface are then examined through a high-powered microscope, to find the largest particle present in the filtrate, so giving the absolute rating of the filter.
The degree of filtration is determined in apparatus very similar to that of Figure 1.15 , except that the weight of contaminant added is measured, as is the weight of particles passing through in the filtrate. The degree of filtration is then determined as:

where: W1=weight of added contaminant, and W2=weight of filtrate solids collected on the membrane filter.
This calculated figure also establishes a nominal rating for the filter, relative to the specified contaminant.
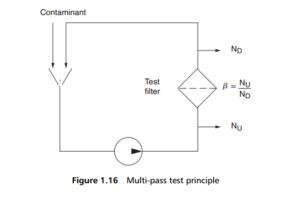
The multi-pass test is intended specifically to determine the beta ratio, as described in Section 1D; for example, for filters used in hydraulic and lubrication systems. The principle of the test rig is shown in Figure 1.16 , in which a fluid carrying a specific load of particles, of known size and number composition, is continuously circulated around a loop through a test filter housing with its sample points. Additional suspension is continually fed into the circulating flow to maintain a constant flow
of contaminants into the test filter, making up for the particles lost through being trapped in the filter, and for the fluid removed from the system as samples. These samples are withdrawn simultaneously from upstream and downstream of the filter, at predetermined levels of the pressure drop across the test filter, and are analysed in an automatic particle counter. The contaminant will be a standard test dust, such as ISO Medium Test Dust for the hydraulic and lubricating systems suggested.
From the counted samples, the cumulative particle size distribution in unit volume of the fluid is then determined, over a range of sizes to match the fed dust (such as 5, 10, 20, 30 and 40 μm). The beta ratio can then be calculated for each of
the selected particle sizes (as in Section 1D) from:

with the corresponding efficiency as:

again, for the specific particle size.
The multi-pass test simulates well the behaviour of clarifying filters in hydraulic or lubricating fluid systems, because the recycle of the filtrate carries with it the undersized particles, so that the proportion of fine particles increases continuously
during the test. It was the first filter test to become an ANSI standard, and is now incorporated into an international standard (see BS ISO 16889:1999). It should be noted that the beta ratio will be different from that determined by this test if it is used in a system that contains particle distributions that differ from the distribution used in the test.
Many filter elements exhibit beta ratios that degrade significantly as pressure drops increase. A multi-pass test must therefore be run to a terminal pressure drop that is higher than the operational setting of the dirty element warning device in say a real hydraulic system, to obtain realistic beta ratios for the entire expected life of the filter. It is thus necessary, when a hydraulic filter is being selected, to compare the plot of the beta ratio against differential pressure from the clean element pressure drop all the way through to terminal pressure drop, and to compare this plot with the settings of the dirty element alarm and any bypass valve.
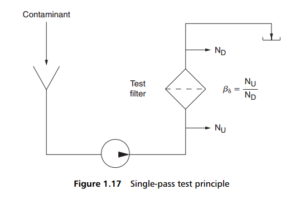
collected in a separate receiver, and solids trapped in the test filter are allowed to accumulate, with a corresponding rise in the differential pressure across the filter. Simultaneous samples of feed and filtrate are made and particle counts obtained as
with the multi-pass test, and the beta ratio and efficiency figures are calculated in the same way.
The single-pass test thus presents the test filter with an unchanging feed composition, which more closely duplicates the majority of filtration processes, which have relatively unaltered feed during operation. In this test, changes in filter performance are reflected by changes in the downstream conditions. It is possible, with this test, to show more easily the effect of important variables on filter performance. One of these is the ability of a filter element to hold sufficient solid contaminants without the development of an unacceptable pressure drop – the retention capacity of a filter element is easily determined in a single-pass test.
Companies offering testing services, such as IFTS in France, or Palas in Germany, have fully automated test rigs, able to carry out single and multi-pass tests quickly and accurately.
Bubble point test
The tests described so far have all been challenge tests, in which a known suspension is fed to a test filter. The bubble point test, on the other hand, measures a characteristic of the filter medium without use of particles.
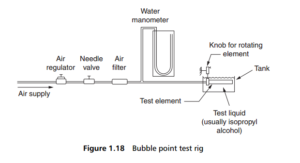
The bubble point test is based on the fact that, for a porous filter medium, immersed in and thoroughly wetted by a specific liquid, the pressure required to force a gas bubble through a pore is inversely proportional to the diameter of the pore. In practice, this means that the pore size of a filter element can be established by wetting the element completely with the liquid and measuring the pressure at which the first stream of bubbles is emitted from the upper surface of the element
when air pressure is applied to the underside.
A typical rig for the bubble point test is shown in Figure 1.18 . The sample of filter medium is immersed in a suitable liquid (often i-propyl alcohol), and air is forced into the interior of the sample from a reservoir until the first bubble is seen,
at which point the air pressure is recorded.
The relationship between bubble point pressure and pore diameter derives from Poiseuille ’ s law for capillary tubes:

where: P= bubble point pressure, r= surface tension of the liquid, which must wet the capillary wall, θ=angle of contact between wall and wetting liquid, and d = pore diameter.
As no real pore is absolutely capillary in shape, it becomes necessary to introduce an empirical constant into this relationship:

In a given liquid/material combination, r and θ are effectively constant, so that the relationship becomes:
![]()
with K as another empirical constant dependent upon the nature of the liquid and filter material, and on the form of the units employed in the equation.
In the test procedure, the point on the sample from which the first bubbles appear marks the place of the largest pore. A further increase in pressure will produce a second stream of bubbles, from the second largest hole, then the third, and so on.
Eventually a pressure is reached at which bubbles will appear to come from the entire surface of the element. This pressure is known as the open bubble or boil point, and is a reasonable measure of the mean pore size of the element. This latter
figure is to some extent dependent upon the air velocity through the pores, so comparative tests on different materials should be carried out at the same flow rate (air velocity does not affect the value of the initial bubble point).
In an instrumented form of test rig, a sample of the filter medium, saturated with liquid, is placed in the sample holder, forming a seal between the bottom of the sample chamber and the atmosphere. Gas (usually air) is injected into the space under the sample at a controlled rate causing the pressure in the chamber to increase. When the applied pressure is high enough to force the liquid from the largest pore, it will stop increasing momentarily, which will signal the recorder to
note the applied pressure, the bubble point.
A particular advantage of the bubble point test is that it is non-destructive, i.e. it does not damage nor contaminate the filter element. It can thus be used as the basis for a method of testing the integrity of the filter, i.e. for demonstrating that there are no holes that should not be there, in the body of the filter medium or at its perimeter. The test can also be correlated to bead challenge tests, and combined with a maximum particle passed test, can be used to determine K or K’ for different
designs of filter element using the same medium.
A comparable procedure can be built into a capillary flow porometer, which will enable the carrying out of bubble point, pore distribution, capillary flow and gas permeability determinations.
It has already been mentioned that the single-pass flow test is capable of determining the ability of the filter medium to hold accumulated dirt on or within the medium. A rather more complicated rig for this purpose is shown in Figure 1.19, which can be used for determining the lifetime of the filter element, in terms of the maximum acceptable pressure drop across the element, as determined by the amount of solid accumulated in or on it. In the system shown in Figure 1.19 , a continuous flow of suspension is maintained through the test element. A specified amount of contaminant is added to the flow upstream of the element at regular time intervals, and the differential pressure across the element is recorded, so that a graph may be drawn of contaminant added vs pressure drop. It will be possible to specify the maximum pressure drop that will be acceptable across the element (in terms of fluid pumping energy), and therefore the maximum solid accumulation permitted – and hence the time between element changes.
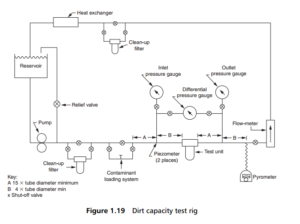
In the same, or a similar, rig to that of Figure 1.19, but without the addition of contaminant solid, the clean fluid is circulated at measured flow rates and controlled temperatures. A plot can then be drawn of the clean element pressure drop against
fluid flow rate. This can be done first in the absence of the element, to determine the resistance of the filter housing alone, followed by that of the combined element and housing. It may be possible to check the behaviour of the element alone, from
which it may be found that the drop across element and housing may not be the exact sum of the two separately.
A continuation of the pressure drop test, now using contaminated fluid, at the flow rate expected for the filter in use, will allow the differential pressure to rise (given a pump capable of achieving the differentials) to the point where the element is
caused to fail or collapse.
In any filtration process, but especially in clarifying processes designed to produce a clean filtrate, it obviously must not be possible for fragments of the filter medium to fall off the element and so contaminate the filtrate. A rig suitable for checking on migration behaviour is similar to that used for the maximum particle passing test (i.e. Figure 1.15 ), now only with clean fluid passing continuously through the test sample, so that the only contaminants collecting on the membrane filter are those that have migrated from the sample. Loss rates can be plotted against time and flow rate.
Migration tests should, as necessary, be modified to simulate actual service conditions, including other parameters such as fluctuating flow, flow reversal and mechanical vibration.
Fatigue tests
The test circuit used for fatigue tests subjects the filter to start-stop cycles (for evaluating fatigue behaviour under otherwise steady flow conditions), or to cycles of pressure fluctuation (for evaluation of fatigue under pulsating flow conditions). A bubble point test applied to the filter element before the fatigue test, and again after it, will demonstrate the integrity of the filter.
Acceptable figures for cycle life before failure can vary widely with different types of filter element, but as a general guide they are of the order of 10,000 cycles for steady flow operation, and anywhere from 100,000 to 1,250,000 cycles for pulsating flow.
To be continued.