0
-
An empty cart
You have no item in your shopping cart
envato-wordpress-toolkit domain was triggered too early. This is usually an indicator for some code in the plugin or theme running too early. Translations should be loaded at the init action or later. Please see Debugging in WordPress for more information. (This message was added in version 6.7.0.) in /var/www/wp-includes/functions.php on line 6121g5plus-darna domain was triggered too early. This is usually an indicator for some code in the plugin or theme running too early. Translations should be loaded at the init action or later. Please see Debugging in WordPress for more information. (This message was added in version 6.7.0.) in /var/www/wp-includes/functions.php on line 6121The permeability is the reciprocal of the resistance to flow offered by the filter – thus, high permeability represents a low resistance and vice versa. Permeability is usually expressed in terms of a permeability coefficient, which is directly proportional to the product of flow rate, fluid viscosity and filter medium thickness, and inversely proportional to the product of filter area and fluid density, which gives the permeability coefficient the dimension of a length.
Such a derivation is cumbersome, and permeability behaviour is better expressed by a series of curves relating pressure drop across the filter medium with flow rate of the fluid through it. A separate series of pressure drop curves can be set up with
respect to:
● filter size (i.e. filtration area)
● fluid temperature, and
● filtration time (i.e. degree of contamination of the medium).
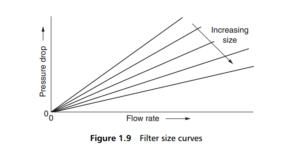
A typical set of curves for the relationship with filter size is given in Figure 1.9 . For a given flow rate, an increase in filter area will reduce the pressure drop across the filter, because the amount of fluid flowing per unit of filtration area is decreased (pressure drop is inversely proportional to filter area). This leads to a standard method for the sizing of a filter, a combination of the process flow rate required and an acceptable pressure drop leading to the optimum area (although it should be noted that the pressure drop will increase with filtration time as the medium becomes clogged).

If the medium thickness is increased at the same time as its area, then a different set of curves will be produced, because the medium also imposes a restriction on the flow of fluid. Each individual filter element will, therefore, have its own specific pressure drop-flow rate curve, depending upon its area, thickness and permeability.
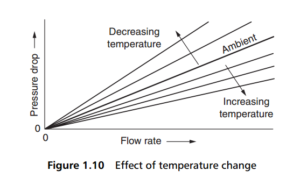
The operating temperature of the fluid will affect the pressure drop across the filter because the fluid viscosity will change. A less viscous fluid will experience less resistance to flow through the medium, and so a lower pressure drop will be needed
to drive it. As a result, pressure drop is inversely proportional to temperature, with a decrease in temperature causing a rise in pressure drop, as shown in Figure 1.10. A series of pressure drop vs flow rate curves at differing temperatures will thus
establish the characteristics of a single filter over its working temperature range. (It should be noted that the temperature effect is much more pronounced for liquids than for gases.)

An impact on fluid velocity is not the only potential effect of temperature change. At low temperatures, water contained in oil may freeze, causing blockage or at least partial blockage of the filter, and an abnormal rise in pressure drop. A similar effect
occurs with waxes dissolved in an oil. These are changes that must be guarded against in an aircraft flying high, or a ship sailing into polar waters.
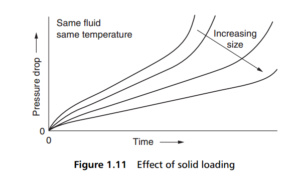
The effect of prolonged filtration time is to produce a cumulative build-up of collected solids on or in the filter medium, thus reducing permeability (and increasing flow resistance) in direct proportion to the amount of solid collected, as shown in
Figure 1.11 , which is another set of curves specific to an individual filter.
Characteristics expressed in the manner of Figure 1.11 are not particularly useful, because a practical filter will have been sized for a design flow rate, and this is then a

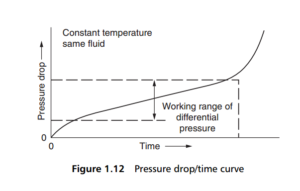
working figure. It is more informative to plot the pressure drop across the filter as it changes with filtration time, to yield a single curve, as shown in Figure 1.12 . The fact that this increase is caused by a build-up of contaminants is only a cause, and not an effect, although the load of contaminants retained by a filter during its working cycle can be significant as it may dictate the choice both of the type and of the size of the filter element.

The shape of the curve in Figure 1.12 is very typical: a fairly sharp initial rise, falling away to a prolonged linear growth section, which then curves up into a much steeper rise. The point at which this steeper rise begins is the time beyond
which the filter will be too clogged for effective use – the efficiency will continue to increase with pressure drop, but the cost of operation becomes too high, and the element must be cleaned or changed.
The sharp increase in pressure drop can be used to indicate the need for the change, or it can cause the switch between an operating filter and its standby unit in a duplex housing.